This blog post is all about micro optimizations. We will look at a naive implementation of a sum function, and optimize it to gain 23.5x performance.
We won’t be introducing any parallel code here, which is the obvious choice for this particular problem.

Ready? Great. Go ahead and read the prologue.
! Disclaimer: This post is based on Computer Systems: A Programmer’s Perspective, chapters 5.1 - 5.6.
Prologue
Compilers are really smart, and can perform neat optimizations. Most of the time, their optimizations are scoped to a local block for many reasons, including:
- Analysis of entire programs consume a lot of time
- Inability to perform optimizations that might cause memory aliasing
- Inability to perform optimizations that might cause unknown side effects
- and many more…
The point is that we can make assumptions about the code that compilers can’t, and thus increase its speed significantly.
All the code has been compiled using gcc, with optimization level 2. From gcc‘s man page:
-O1 Optimize. Optimizing compilation takes somewhat more time, and a lot more memory for a large function.
-O2 Optimize even more. GCC performs nearly all supported optimizations that do not involve a space-speed tradeoff. The compiler does not perform loop unrolling or function inlining when you specify -O2. As compared to -O, this option increases both compilation time and the performance of the generated code.
-O3 Optimize yet more. -O3 turns on all optimizations specified by -O2 and also turns on the -finline-functions, -funswitch-loops, -fpredictive-commoning, -fgcse-after-reload and -ftree-vectorize options.
-O0 Reduce compilation time and make debugging produce the expected results. This is the default.
-Os Optimize for size. -Os enables all -O2 optimizations that do not typically increase code size. It also performs further optimizations designed to reduce code size.
Furthermore, we’ll be measuring the code in cycles per element. If you’re interested in how to do so, read: How to determine CPE: Cycles Per Element.
Version 1.0
Here’s a naive implementation of a sum function:
/** |
The code is pretty straight forward. But it takes a whopping 31.25 clock cycles to run optimized, and 42.06 using debug symbols!
You’d probably think that the algorithm time complexity is O(N), but actually its O(N^2)!
Why? because vec_length calculates the length of the vector each time the condition block is run.
The compiler can’t optimize that block of code because it doesn’t know if vec_length has any side effects. We can fix that in two ways:
- Move the
vec_lengthcalculation to a variable - Hint the compiler that the function doesn’t have any side effects using either the const or pure attributes.
pure & const attributes
__attribute__((const)) int foo() { |
__attribute__((pure)) hints to compilers that the function has no side-effects, and is subject to data flow analysis and might be eliminated.
__attribute__((const)) is the same, but also means that the function doesn’t access any global variables. You can read more here.
Version 2.0
The same as version 1.0, only this time, vec_length has been moved outside the condition block.
void sum(int *v, int *dest) { |
! This little trick brought down the CPE from 31.25 down to 20.66.
What now? well, get_vec_element accesses the i element from the vector. It doesn’t know if the vector actually has i elements, so it performs a bounds check.
The vector is laid out sequentially in memory, so we can completely remove the call to get_vec_element and access each element directly!
If you’re afraid of removing the bounds check, you can always add assert statements that are only compiled in debug mode, and removed in release.
Version 3.0
This time, we removed the get_vec_element call and directly accessed each element.
void sum(int *v, int *dest) { |
! This optimization brought down the CPE from 20.66 down to 6.00!
This might have looked like a small optimization, but in such a tight loop, an added function call and bounds check can have a significant overhead.
Can we go any further? Well, the for loop de-references the dest pointer on each iteration. That means we need to access the memory on every iteration!
Why? because the compiler can’t optimize that piece of code as a result of memory aliasing, which basically means it has no idea if anyone else is touching this pointer too, so it just leaves it alone.
Version 4.0
This time, we added a local sum variable, and set the value of dest at the end of the loop.
void sum(int *v, int *dest) { |
! This optimization brought down the CPE from 6.00 down to 2.00.
Notice the register keyword? We’re hinting the compiler to store the sum in a register, which is significantly faster then accessing any cache: L1,L2,L3 & RAM.
Honestly, we could’ve omitted the register keyword, because it’s kind of deprecated nowadays. Both gcc and clang are smart enough to put the sum variable in a register without us explicit telling them.
Can we go any further? maybe we can leverage instruction pipelining:
“Instruction pipelining is a technique that implements a form of parallelism called instruction-level parallelism within a single processor. It therefore allows faster CPU throughput than would otherwise be possible at a given clock rate. The basic instruction cycle is broken up into a series called a pipeline. Rather than processing each instruction sequentially, each instruction is split up into a sequence of dependent steps so different steps can be executed in parallel and instructions can be processed concurrently…” - Wikipedia
There are techniques to take advantage of pipelining, for instance, loop unrolling:
“Loop unrolling, also known as loop unwinding, is a loop transformation technique that attempts to optimize a program’s execution speed at the expense of its binary size, which is an approach known as the space-time tradeoff. The transformation can be undertaken manually by the programmer or by an optimizing compiler.” - Wikipedia
Vectorization
Whenever you perform the same operation to all elements of a vector you can either do it one by one, or in chunks.
- You can do it by splitting the chunks across different processors.
- You can tell your processor to process a whole chunk at once.
- You can split your vector in chunks, send it to multiple processors and then tell each processor to work on a chunk of that chunk.
If you opt to process by chunks on a single processor, you will then use a special set of instructions called Single Instruction Multiple Data, or SIMD for short.
SIMD allows supporting processing to perform the same operation on multiple data points simultaneously. Thus, such machines exploit data level parallelism, but not concurrency: there are simultaneous computations, but only a single process (instruction) at a given moment.
You can read more on this topic on Nicolas Brailovsky’s blog - An Infinite Monkey.
Version 5.0
This time we use the ‘loop unrolling’ technique - we split up the code to sum three numbers during the same iteration, thus leveraging pipelining. All remaining items are summarized in a separate loop.
void sum(int *v, int *dest) { |
! This optimization brought down the CPE from 2.00 down to 1.33.
All modern processors can pipeline LOAD (read from memory) & ADD (add numbers) instructions, so the previous optimization will work on all modern processors.
Furthermore, it can actually be optimized further to leverage CPU specific traits. For instance, in this example, the processor’s ADD latency & cycle-per-issue is 1, while LOAD‘s latency is 3, and cycles-per-issue is 1. So it can effectively pipeline three numbers at the same time.
in reality, things are more complicated, but that’s out of scope for now.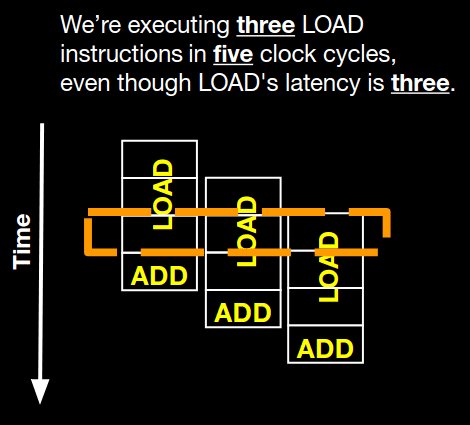
Final thoughts
At the end, we gained 23.5x performance increase by moving code around. If you look back, everything looks very straight forward. But there’s a lot of theory behind all these optimizations!
I love optimizing code. It’s a lot of fun, and each time I optimized a piece of code, I learn a lot about the internals of the language that code was written in.
That doesn’t mean optimizations are easy, but don’t be afraid to profile your code. Sometimes a small change can provide substantial performance increase!
Anyhow, if you found this post interesting, consider following Oren Eini, the creator of RavenDB. He’s a wizard when it comes to optimizations.
Oh, and don’t forget my motto’s:
- Don’t optimize your code in advance. Most of the time, optimizations hurt readability. That doesn’t mean your’e granted to write stupid code ;)
- NEVER Shoot in the dark. ALWAYS use a profiler to find slow code paths.
- Don’t be afraid to dive deep! I once optimized a python
dictto gain 6x performance! read {}
vs dict to learn more.